

Crash Course: The Squarespace Commerce Analytics Panel
Before you launch your site, you’re working off of a lot of guesses and hypotheses. You’re assuming a lot about your customers and their behavior based on your market research and industry knowledge. But after you launch? That’s when the fun begins. Now you have data to either back up your predictions… or help you tweak and refine your content and products.
I love the Squarespace Analytics panel because the graphs and charts are simple, easy-to-read, and straightforward. You can always head over to Google Analytics for a deep dive into some more obscure stats but there’s really no need! It’s so important to use analytic data to help you meet your business and eCommerce goals in a measurable way. Here’s a quick crash course on using Squarespace Analytics to understand how your site is performing.
Analytics Tips
The data shown in your analytics panel is almost real-time - but things may take a couple of hours to refresh. I usually wait until the first or second day of a new month to check out last month’s data.
It’s helpful if you make notes or keep track of things like ad campaigns or big site changes so that you can see how those things affect your data.
If you have reports that you look at often, you can save links to those directly to your Squarespace home screen. To do this go to Home > Settings > Advanced > Menu Shortcuts. From here you can toggle on anything you want to be able to access quickly from your main dashboard.
To ignore your own activity make sure you are logged in to Squarespace when viewing your site. This will automatically exclude your own views from the reports. You can also create a filter to exclude your IP address in Google Analytics.
Now that you know a few ins and outs of analytics, it’s time to learn about some of the most important metrics to check out and what they mean for your business!
Basics
Pageviews
This is basically a popularity ranking for all the pages on your site. If you have pages that you think should be more popular than they are, you may want to look at the navigation of your site or where/how you link to that page. This doesn’t really measure how effective your pages are though so for that check out some of the metrics below.
Time on Page
This is a measurement of how long people spend on a page before leaving for another part of your site. People who leave that page to go to a different site are not counted (those are part of the exit rate, below.) Time on page is this formula: (Total time spent on page / (Pageviews - Exits)). If you feel like people are coming to your site but not sticking around you might want to look at your messaging, keywords, or content. A short time spent on a page indicates that there might be a mismatch between your target audience and your content.
Bounce Rate
Think of this as the people who came to your site and then left without going anywhere - they just bounced right off! If your bounce rate is really high, this also signals a content problem. You’d want to look at what keywords people are using to find your site and make sure that the content and CTAs on that page are all in alignment. You want to make sure that each page clearly describes what the page is about and that it corresponds to the action you’re wanting the visitor to take.
Exit Rate
Exit rate is commonly confused with bounce rate but understanding the difference can be helpful. Whereas bounce rate can show you which initial pages people landed on that didn’t resonate with them, exit rate is going to show you where you’re losing people who have seen other pages on your site along their journey. Think of this kind of like a purchase funnel but for content.
For example, if you have a landing page that’s supposed to lead to a product/shop page it should have a low exit rate. If it has a high exit rate, you should look at why people are leaving that page without doing what you intended. Maybe you could improve the copy or button placement or make it easier for visitors by embedding your product right on the page instead of asking people to click again.
Form & Button Conversions
Forms and buttons are important CTAs (calls-to-action) and you want submissions and clicks! Squarespace makes it easy to see how people are interacting with forms and buttons and it is shown as this formula: Number of times the form or button is viewed / number of submissions or clicks. Low conversion rates might mean that people just aren’t seeing your CTAs. If that’s the case you can try moving them up the page so people don’t have to scroll so much. You may also want to adjust how much information you’re asking for in your forms - long forms are proven to be lower converting than short ones.
Commerce Analytics
Sales by Product
This is a great place to see how each product in your store is performing. Understanding which products are most popular can help you make business decisions about when to order more stock, what to put on sale, or which products might need some TLC in order to better appeal to your customers. Stats on this page include:
Revenue
Units sold
Orders
Views
Conversion Rate
Purchase Funnel
You’ve probably heard of a purchase funnel before when you were busy pulling your hair out trying to set one up manually in Google Analytics 🙃 Luckily, Squarespace makes it easy and you can check out this page to see things like how many visits result in purchases or where you’re losing customers along the way.
The four stages of the purchase funnel are: Visits > Viewed Product > Added to Cart or Started Checkout > Purchased. The percentages between each step are how many people moved on to the next stage. If you make updates to your page content, product descriptions, or prices checking out the purchase funnel analytics can help you see how conversion rates improve over time as a result.

You can also tell a lot about updates you may need to make based on where you’re losing people. For example: if you lose people on the cart page perhaps the shipping costs are too high. If people aren’t even making it that far, you may want to look at how you’re promoting or merchandising your products.
One last thing to note about the purchase funnel is that views from Product Details Pages and product Quick Views are included however views from the main store page or from product blocks or summary blocks are not. This is just something to keep in mind if you use those design elements as part of your website.
Abandoned Cart
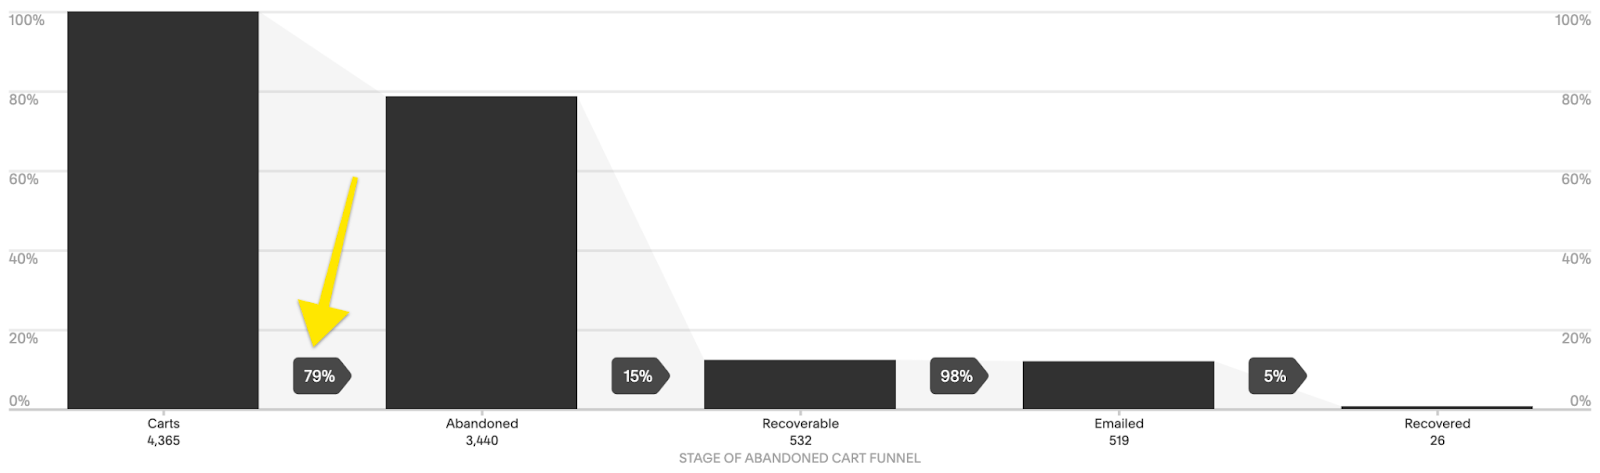
When you’re looking at your purchase funnel (above) you’re paying attention to people that made it all the way through to purchase. But some people ditch out between the Added to Cart / Started Checkout phase and purchase. Those people are counted as Abandoned Carts. The Abandoned Cart funnel includes 5 phases:
Carts - total number of carts that were started
Abandoned - total number of carts with at least one product added that didn’t result in a check out within 24 hours
Recoverable - the total number of customers who abandoned their carts that are eligible to receive an abandoned cart recovery email. (To be eligible they either need to have entered their email address into the cart without checking out or have been logged in to their account when they ditched out.)
Emailed - the number of people who received an abandoned cart recovery email
Recovered - the total number of checkouts that were completed as a result of receiving the abandoned cart recovery email + the revenue boost from those carts!
Good news if you’re seeing a high number of abandoned carts because I think this is one of the easiest metrics to improve upon! You were already doing a lot right to get people interested enough to add an item to their cart so it’s just a matter of figuring out why they aren’t checking out, fixing that, and then giving them a little nudge!
Also, before you get too worried about the reasons why people ditch out, it’s important to remember that sometimes it’s not always about you. There are always personal reasons why people might abandon their carts. Some people might have just become distracted and walked away from their computers. Others may like everything and plan on coming back on their own to purchase when their budget allows for it.
All this being said, there are some things you can do to lower your cart abandonment rates:
Consider adding another payment option so customers can pick one they prefer. If you are already using Stripe (most common), did you know that you can also enable Apple Pay or Afterpay… and if you have a Paypal business account you can also accept Venmo?
Change up your Abandoned Cart Recovery email. Personalizing the content, adding a coupon code, or even just customizing the subject line can all have a big impact. More info on that in this post!
Make sure you include a clear return policy advertised in the footer of your site and linked to in your cart. (Home > Commerce > Checkout > Checkout Page: Store Policies)
Make sure that you keep custom checkout forms short to create a seamless checkout experience.
Enable Customer Accounts so that name, address, phone number, and credit card numbers are saved for your customers to make it faster and easier for them to check out. (Bonus: this also makes sure that people get your Abandoned Cart Recovery emails!)
Other Analytics to Check Out
Google Analytics - good if you’re wanting supplemental data on anything you see in Squarespace Analytics
Stripe Reports - Squarespace reports are good for a high-level view of how your store is performing but probably aren’t going to provide enough info for accounting purposes
Squarespace Email Campaigns - if you use Squarespace Email campaigns from this dashboard you can see stats for all emails like delivered, opened, clicked, and unsubscribed. (Marketing > Email Campaigns)
Squarespace Scheduling - (Scheduling > Reports) if you use Squarespace Scheduling in the reports section you can see stats like the number of appointments, revenue, and total hours booked.